Project 2: Warehouse Data Visualisation
- In collaboration with a supply chain professional, we obtained data from a warehouse (anonymised) with a year’s worth of data. The file detailed various metrics tracked by the warehouse manager over time.
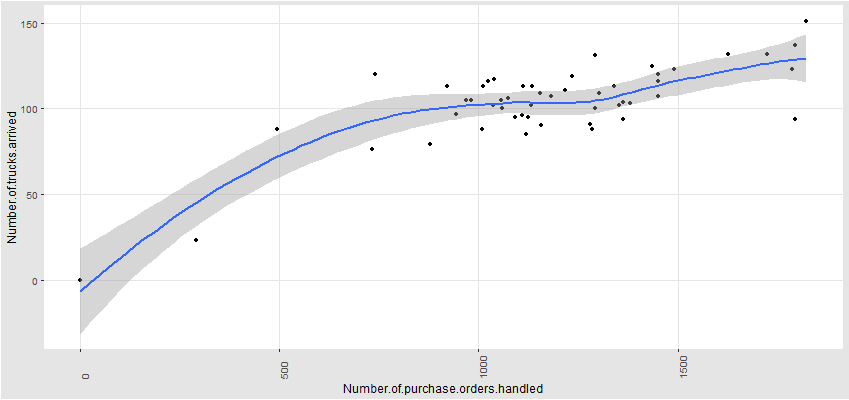
- Our aim was to create a web application to allow for easy visualisation of the data. A fit could also be applied to the data as a basis for forecasting particular supply chain metrics.
- Despite being simple in design, the web application served the primary purpose of visualising data at scale.
- Ideally this app would be used on larger datasets to get the most value out of the visualisations.
- After some required reformatting of the given Excel file, a .csv file was generated for easy plotting.
- R and Shiny were used to create the web app for a user-friendly interface.
View the project on Github:
David-dmh/Warehouse-Data